This tutorial is subdivided into the following sections:
If you have not done so already, download and install the software according to these instructions. There is also a detailed manual for Q-nexus.
wget ftp://ftp.ddbj.nig.ac.jp/ddbj_database/dra/fastq/SRA142/SRA142150/SRX475440/SRR1175698.fastq.bz2
wget http://hgdownload.soe.ucsc.edu/goldenPath/dm3/bigZips/chromFa.tar.gz
tar xvfz chromFa.tar.gz
cat *.fa > dm3.fa
We recommend the following directory structure.
| Directory | Description |
|---|---|
| data | a directory where all the input and output data of the preprocessing resides |
| data/fastq | raw reads |
| data/genomes | reference genomes |
| data/preprocessed | directory where all the output data of the preprocessing goes |
Place the above files into these directories (or directly download into them).
Execute the following commands (If necessary, alter the path so that the shell finds the flexcat executable):
cd data/preprocessed
mkdir SRR1175698
cd SRR1175698
flexcat ../../fastq/SRR1175698.fastq.bz2 -o SRR1175698.fastq -a ~/Q/data/adapters.fa -b ~/Q/data/barcodes.fa -tl 5 -times 5 -t -tt -ss -st -app -tnum 4 -er 0.2 -ol 4 -ml 13
flexcat removes the random and fixed ChIP-nexus barcodes, adds information about the random barcodes to the FASTQ description line, and performs 3' adapter trimming. The reads are now ready to be aligned to the reference genome. If your mapper supports compressed input files, you can also choose your output file to have the ending fastq.gz (Bowtie 1.1.2 does not support compressed input files).
This step will output a series of files. The file SRR1175698_matched_barcode.fastq contains the trimmed reads with information about the random bar code. For instance, the following read was timmed to a length of 28 nucleotides and the random barcode "CGGTA" was removed. If an Adapter was found at the 3' end of the read and was removed, this is also indicated in the header line as shown.
@SRR1175698.988:TL:CGGTA:AdapterRemoved SEB9BZKS1:84:D1F78ACXX:4:1101:5714:2801
length=51
AATTCTTGTCCGTCTTTGACTATTTTCT
+
HHHHJJJJJJJJHIJJJIIJJIJJJJII
Read statistics
===============
Reads processed:	18983666
  Reads dropped:	203043	(1.07%)
    Due to quality:	67623	(33.3%)
    Due to shortness:	135420	(66.7%)
(...)
Mapping is done using Bowtie 1.1.2, which is suitable for the short reads characcteristic of ChIP-nexus data. Note that bowtie requires an index of the reference genome, which can be generate using the following command (assuming that your current working directory is "genome" and the bowtie binaries are on your path; otherwise, adjust the paths) Note the first argument is the name of the FASTA genome file we created above and the second argument is the name of the prefix which will be used for the index files to be written (ebwt_base).
bowtie-build -o 1 dm3.fa dm3The following options are used for the alignment (assuming you start the command from within the preprocessed/SRR1175698 directory; otherwise, adjust the paths).
bowtie -S -p 4 --chunkmbs 512 -k 1 -m 1 -v 2 --strata --best ../../genomes/dm3 SRR1175698_matched_barcode.fastq SRR1175698.samIf all goes well, this command will create a file, SRR1175698.sam, representing the alignment of the ChIP-nexus reads from SRR1175698 to the Drosophila genome.
The mapped reads need to be further processed in order to remove PCR duplicates. ChiP-nexus allows sophisticated processing of PCR duplicates because of the random bar codes of ChIP-nexus adapters, which allow PCR duplicates (same random bar code) to be distinguished from reads that originate from different fragments but map to the same genomic position (different random bar code). The latter occurs much more frequently in ChIP-nexus than in ChIP-seq because of the exonuclease digestion of immunoprecipitated fragments. We remove PCR duplicates using the nexcat application. nexcat also allows reads from noncanonical chromosomes to be removed (which is recommended in general for ChIP-nexus analysis, because such chromosomes tend to be highly enriched for mapping artefacts).
runnexcat -fc '(.*)[H|U|M]+(.*)' -b SRR1175698.samThe Drosophila genome build 3 (dm3) contains two "chromosomes" that are used to place sequences that could not be localised to
one of the six canonical chromosomes. ChrU (U="unknown"), chrUextra. There are also "Het" versions of the
chromosomes (e.g., chrXhet) that contains sequences that could not be localized within the chromosome. These chromosomes are usually
removed before downstream analysis for ChIP-seq and ChIP-nexus experiments. We remove the sequences using next cat with the -fc
flag (filter chromosome). A regular expression can be used (in our example, the regular expression removes all chromosomes whose name
includes the upper case letters U or H (from het), M (for mitochondrial)).
For human data it may be useful to include an underscore ("_")
in the regular expression to remove chromosomes such as chr21_gl000210_random, but users should carefully consider this depending
on the organism and the experimental goals.
See also UCSC explanations.
nexcat produces a BAM file from which PCR duplicates have been removed (SRR1175698_filtered.bam). The file now needs to be sorted and converted to a BAM file prior to downstream analysis with Q-nexus.
samtools sort SRR1175698_filtered.bam SRR1175698_filtered_sorted
samtools index SRR1175698_filtered_sorted.bamWe provide a script called preprocess.py, that enabled you to run all the above mentioned preprocessing steps with one command.
Instead of performing all the steps above separately, you can start the preprocessing pipeline be executing this command
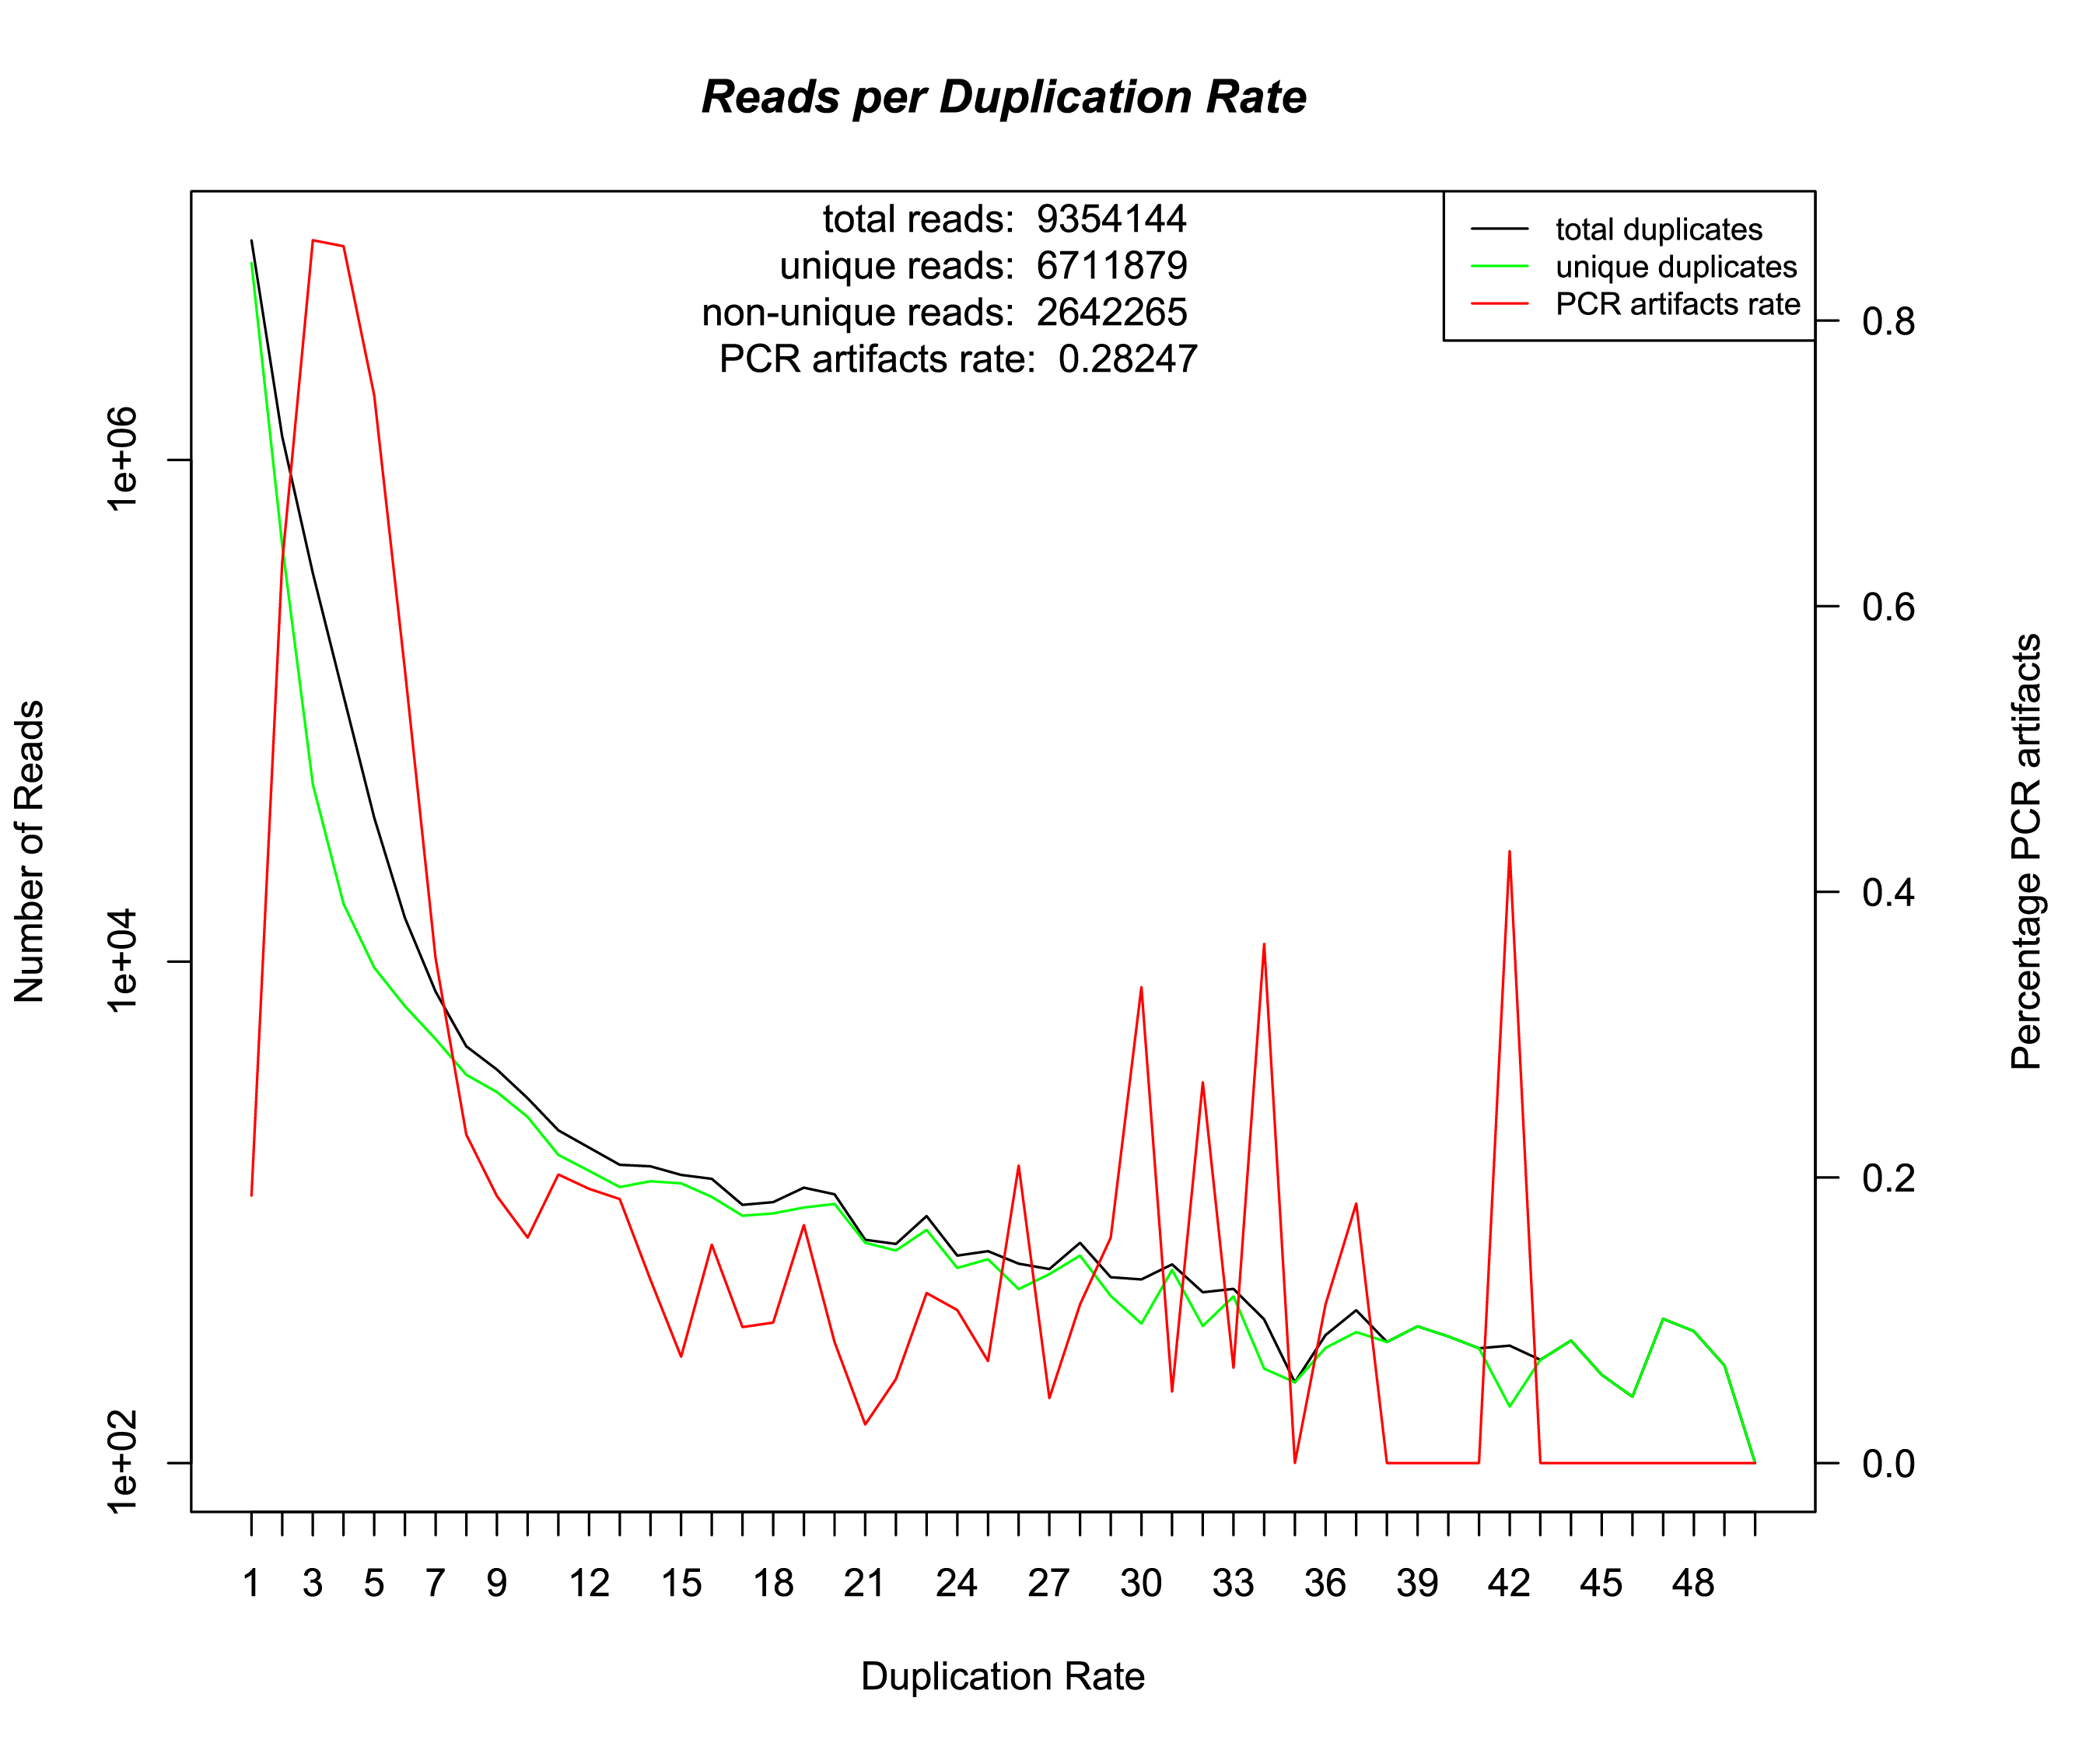
~/Q/scripts/preprocess.py ~/data/fastq/SRR1175698.fastq.bz2 ~/data/genome/dm3.fa --clean --output_dir ~/data/preprocessed/SRR1175698 --verbose --overwriteThe preprocessing pipeline generates a file which is called [INPUT_PREFIX]_duplication_rate.txt. This file containts information about how many reads with a specific coverage rate exist. We also supply and R-script that can generate the following graph out of this txt file.

On the x-axis of this graph is the coverage rate, the left y-axis shows the number of reads. The right y-axis shows the percentage of non unique duplet reads out of all duplet reads. The discrimination of unique and non unique duplicates is for the first time possible, because of the random barcodes used by the ChiP-nexus protocol. The preprocessing output can be further analyzed using the tool FastQC.
If you have the UCSC tools installed, you can also generate bigWig files out of the bedGraph files that nexcat generates.
fetchChromSizes dm3 > dm3.sizes
bedGraphToBigWig SRR1175698_filtered_forward.bed dm3.sizes SRR1175698_filtered_forward.bw
bedGraphToBigWig SRR1175698_filtered_reverse.bed dm3.sizes SRR1175698_filtered_reverse.bw
The preprocessing pipeline also generates a file with statistical information about the preprocessed data. For instance, this is the content of SRR1175698_statistics.txt;
Total reads	16983288
Filtered reads (-fc Option)	736376
Mapped reads	8793415
Non mappable reads	2131841
Non uniquely mappable reads	5321656
After barcode filtering	6286485	 (-2506930)
PCR duplication rate	0.285092
Total duplet reads	1166805
Command line nexcat -fc (.*)[H|U|M]+(.*) -b SRR1175698.samThe original implementation of Q has been designed particularly for ChIP-seq data. Due to the different nature of ChIP-seq and ChIP-nexus data, we made some adjustments of Q to ChIP-nexus data. Using the switch --nexus-mode will cause Q to use optimized parameter settings.
Q --nexus-mode -t ~/data/preprocessed/SRR1175698/SRR1175698_filtered_sorted.bam -o SRR1175698 -s 100 -v
Running Q in nexus-mode will cause Q to keep duplicates (assuming only real and no PCR duplicates for ChIP-nexus data). The parameter -l will be determined using a methodology especially designed for ChIP-nexus data. Furthermore, the evaluation of predicted binding sites differs from the original implementation of Q. Find more detailed informations regarding binding characteristics and peak calling below.
After the analysis is finished, you will find the following files for replicate 1 (and analogous files for replicate 2).
| Filename | Description |
|---|---|
| SRR1175698-Q-runinfo.txt | Contains all chosen parameters and general information about the run. |
| SRR1175698-Q-qfrag-binding-characteristics.R | R script that generates a plot for the fragment-length estimation procedure. |
| SRR1175698-Q-narrowPeak.bed | The actual result and contains the predicted binding sites. Find a detailed description of the narrowPeak format here. |
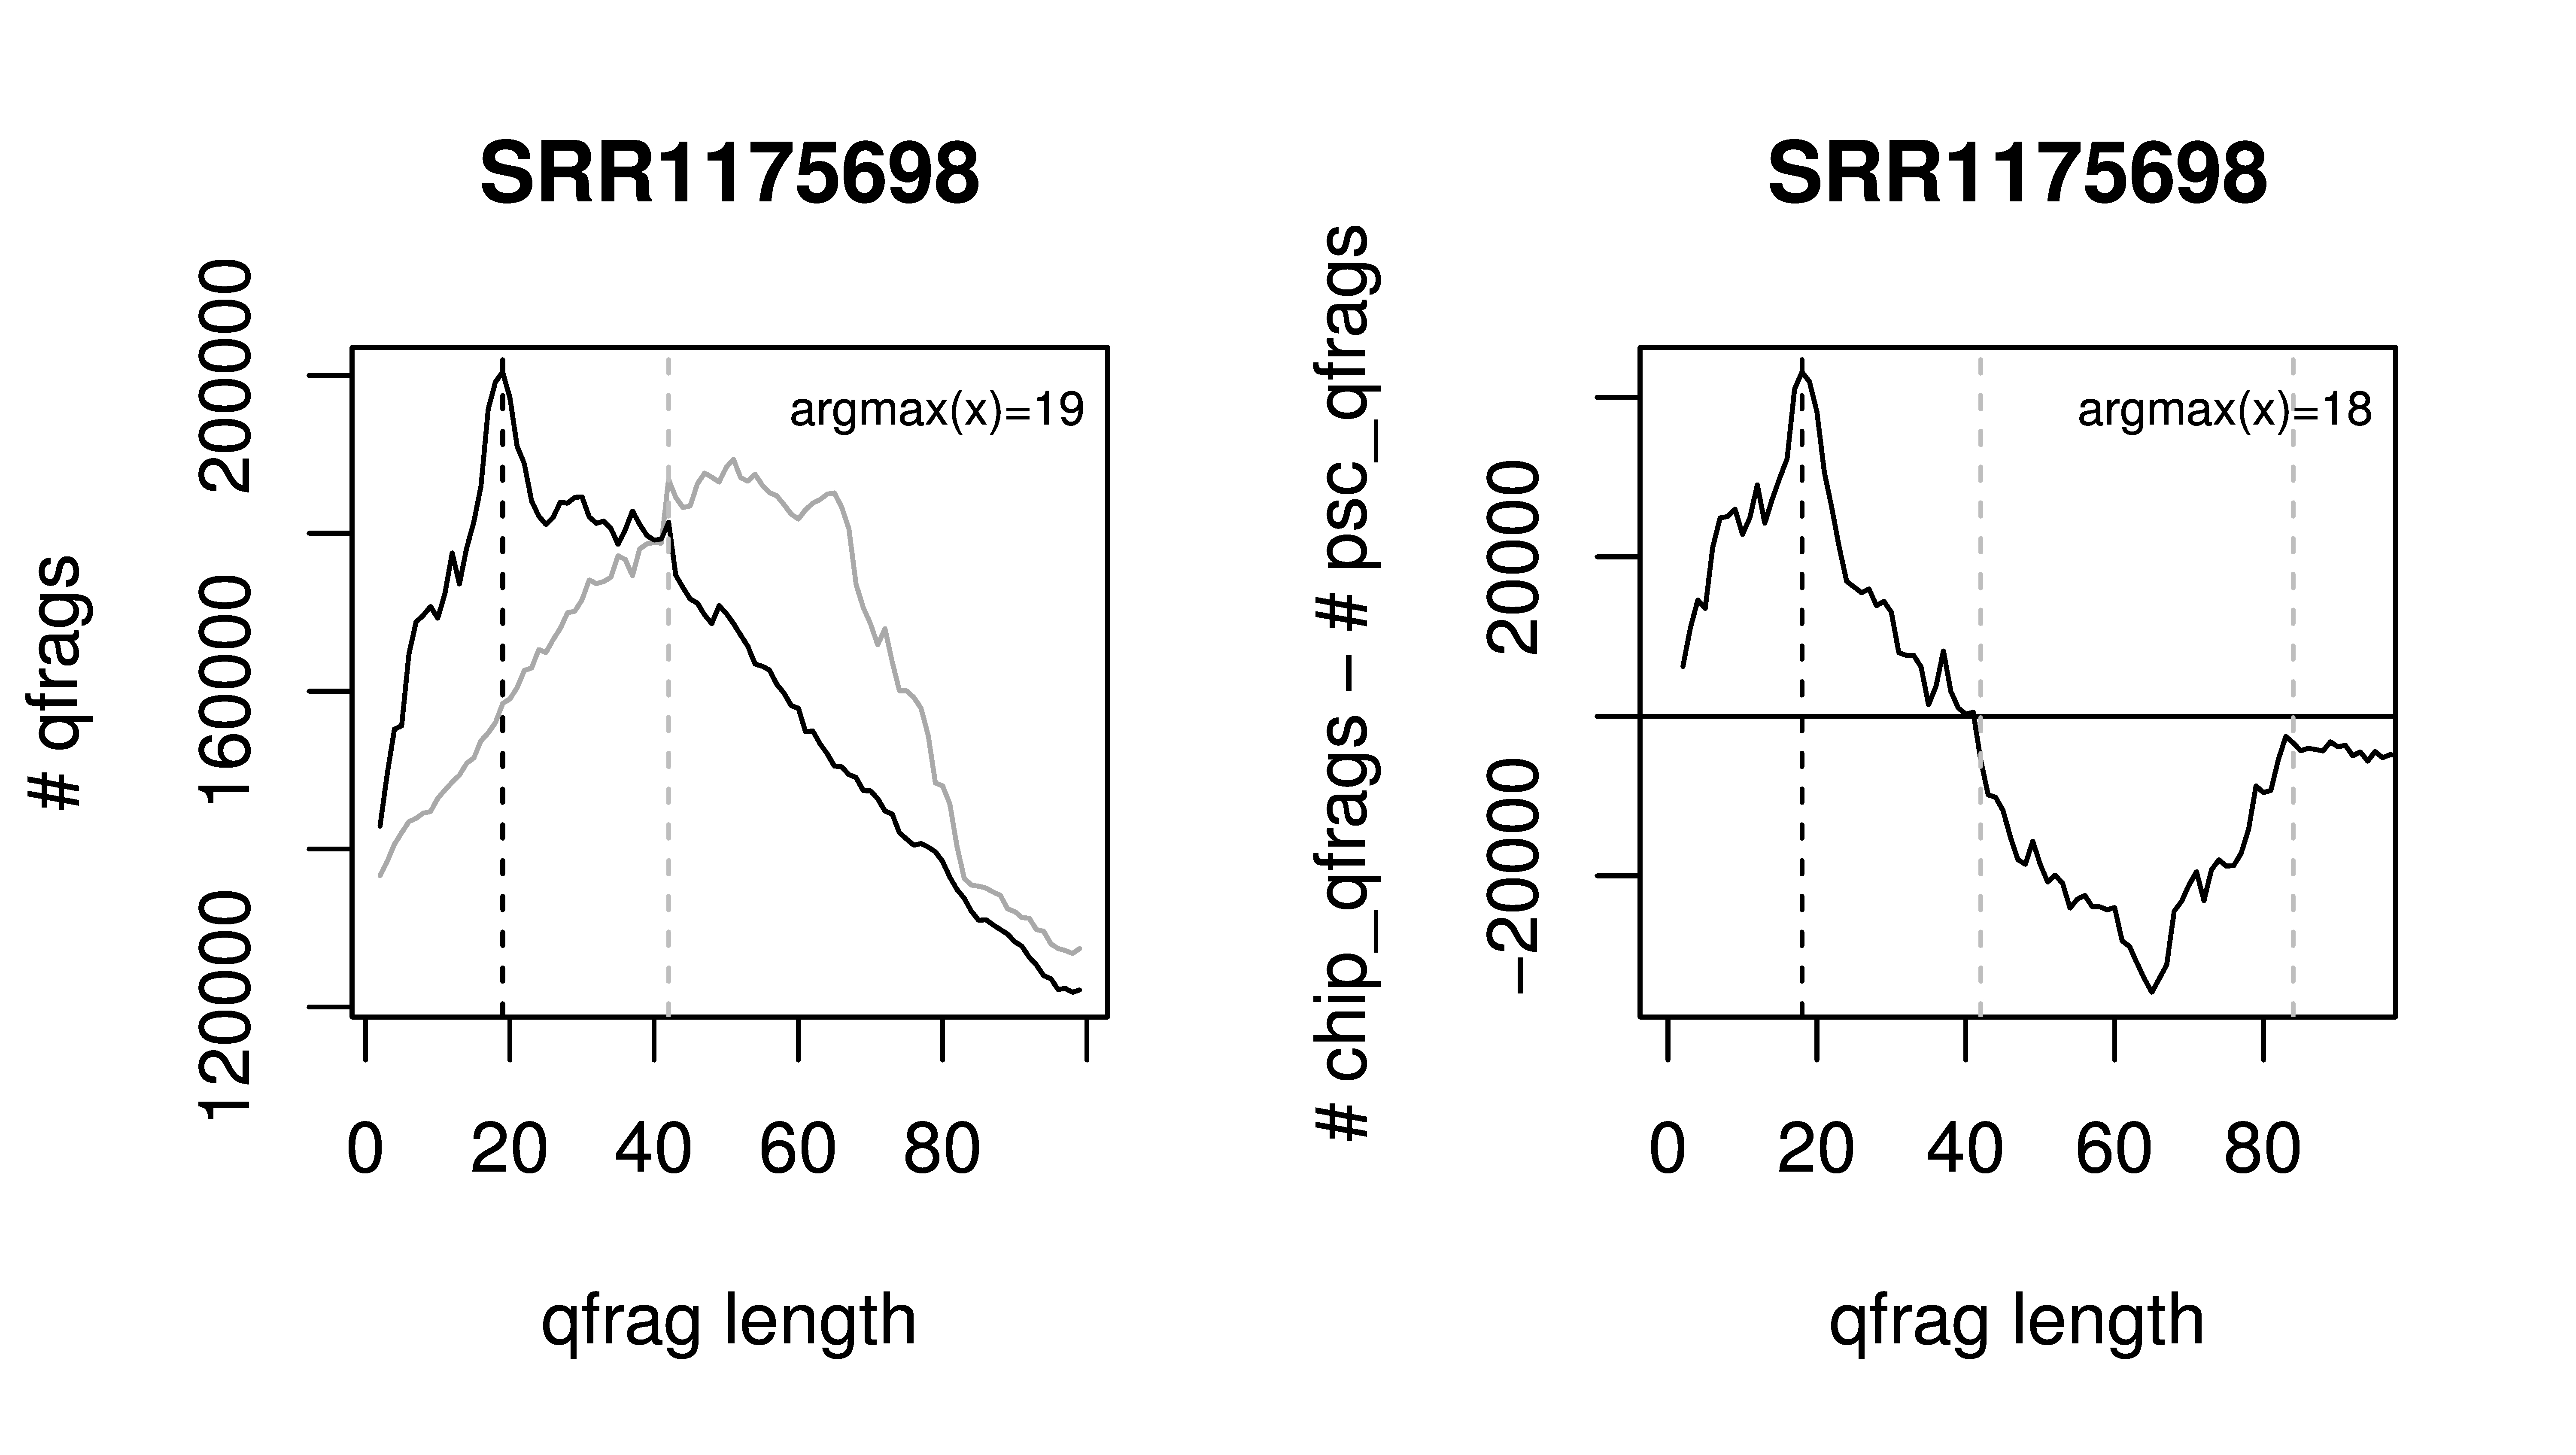
If Q is invoked in nexus-mode and no value for the average fragment length (-l) is specified, it will be set automatically to the predominant qfrag-length observed in the data. This is done by determining the distribution of qfrag-lengths in the given data as well as in the pseudo-control (see publication). Q will produce an R script containing these distributions along with code for generating the corresponding plot (see below), which can be compiled to a pdf using the following command.
Rscript SRR1175698-Q-qfrag-binding-characteristics.R

For the original ChIP-seq dedicated implementation of Q peaks are evaluated regarding of positions around the predicted binding sites that are saturated by at least one 5' end. In contrast, for ChIP-nexus pile-ups of reads mapping to the same position are to be expected. Therefore, peaks are evaluated with regard to the total number of 5' end positions of mapped reads around predicted binding sites. This number is tested for significance using a Poisson distribution. Peaks are reported in narrowPeak format and counts, P-values as well as P-values corrected for multiple tesing can be found in column 7, 8 and 9, respectively.